See how your reporting really works.
Reperta connects to the spreadsheets, BI tools and databases your business reports from. It shows how every figure is calculated, where reports disagree and who owns them. Then it helps you fix what matters and keep it right.
Case 001: September revenue
Which one is
your revenue?
Same company. Same month. Three reports, three answers. Which one goes to the board?
Tap a suspect to hear its statement, or let the case play. It takes thirty seconds.
- Same company. Same month. Three reports, three answers. Which one goes to the board?
- Finance counts a sale when it is invoiced, less credit notes.
- Sales counts it the day the contract is signed.
- The board pack adds up three regional tabs at last year's exchange rates. Nobody knows who built it.
- Nobody is lying. Nobody ever agreed what revenue means.
- Reperta puts every version side by side. Finance signs off one definition, the board pack is corrected and Sales' figure gets its real name: bookings.
- Six weeks later someone saves FINAL v3. The board pack reoffends.
- Reperta catches it on the next scan and the owner puts it right before the board ever sees it.
- Thirty seconds, one number, case closed.
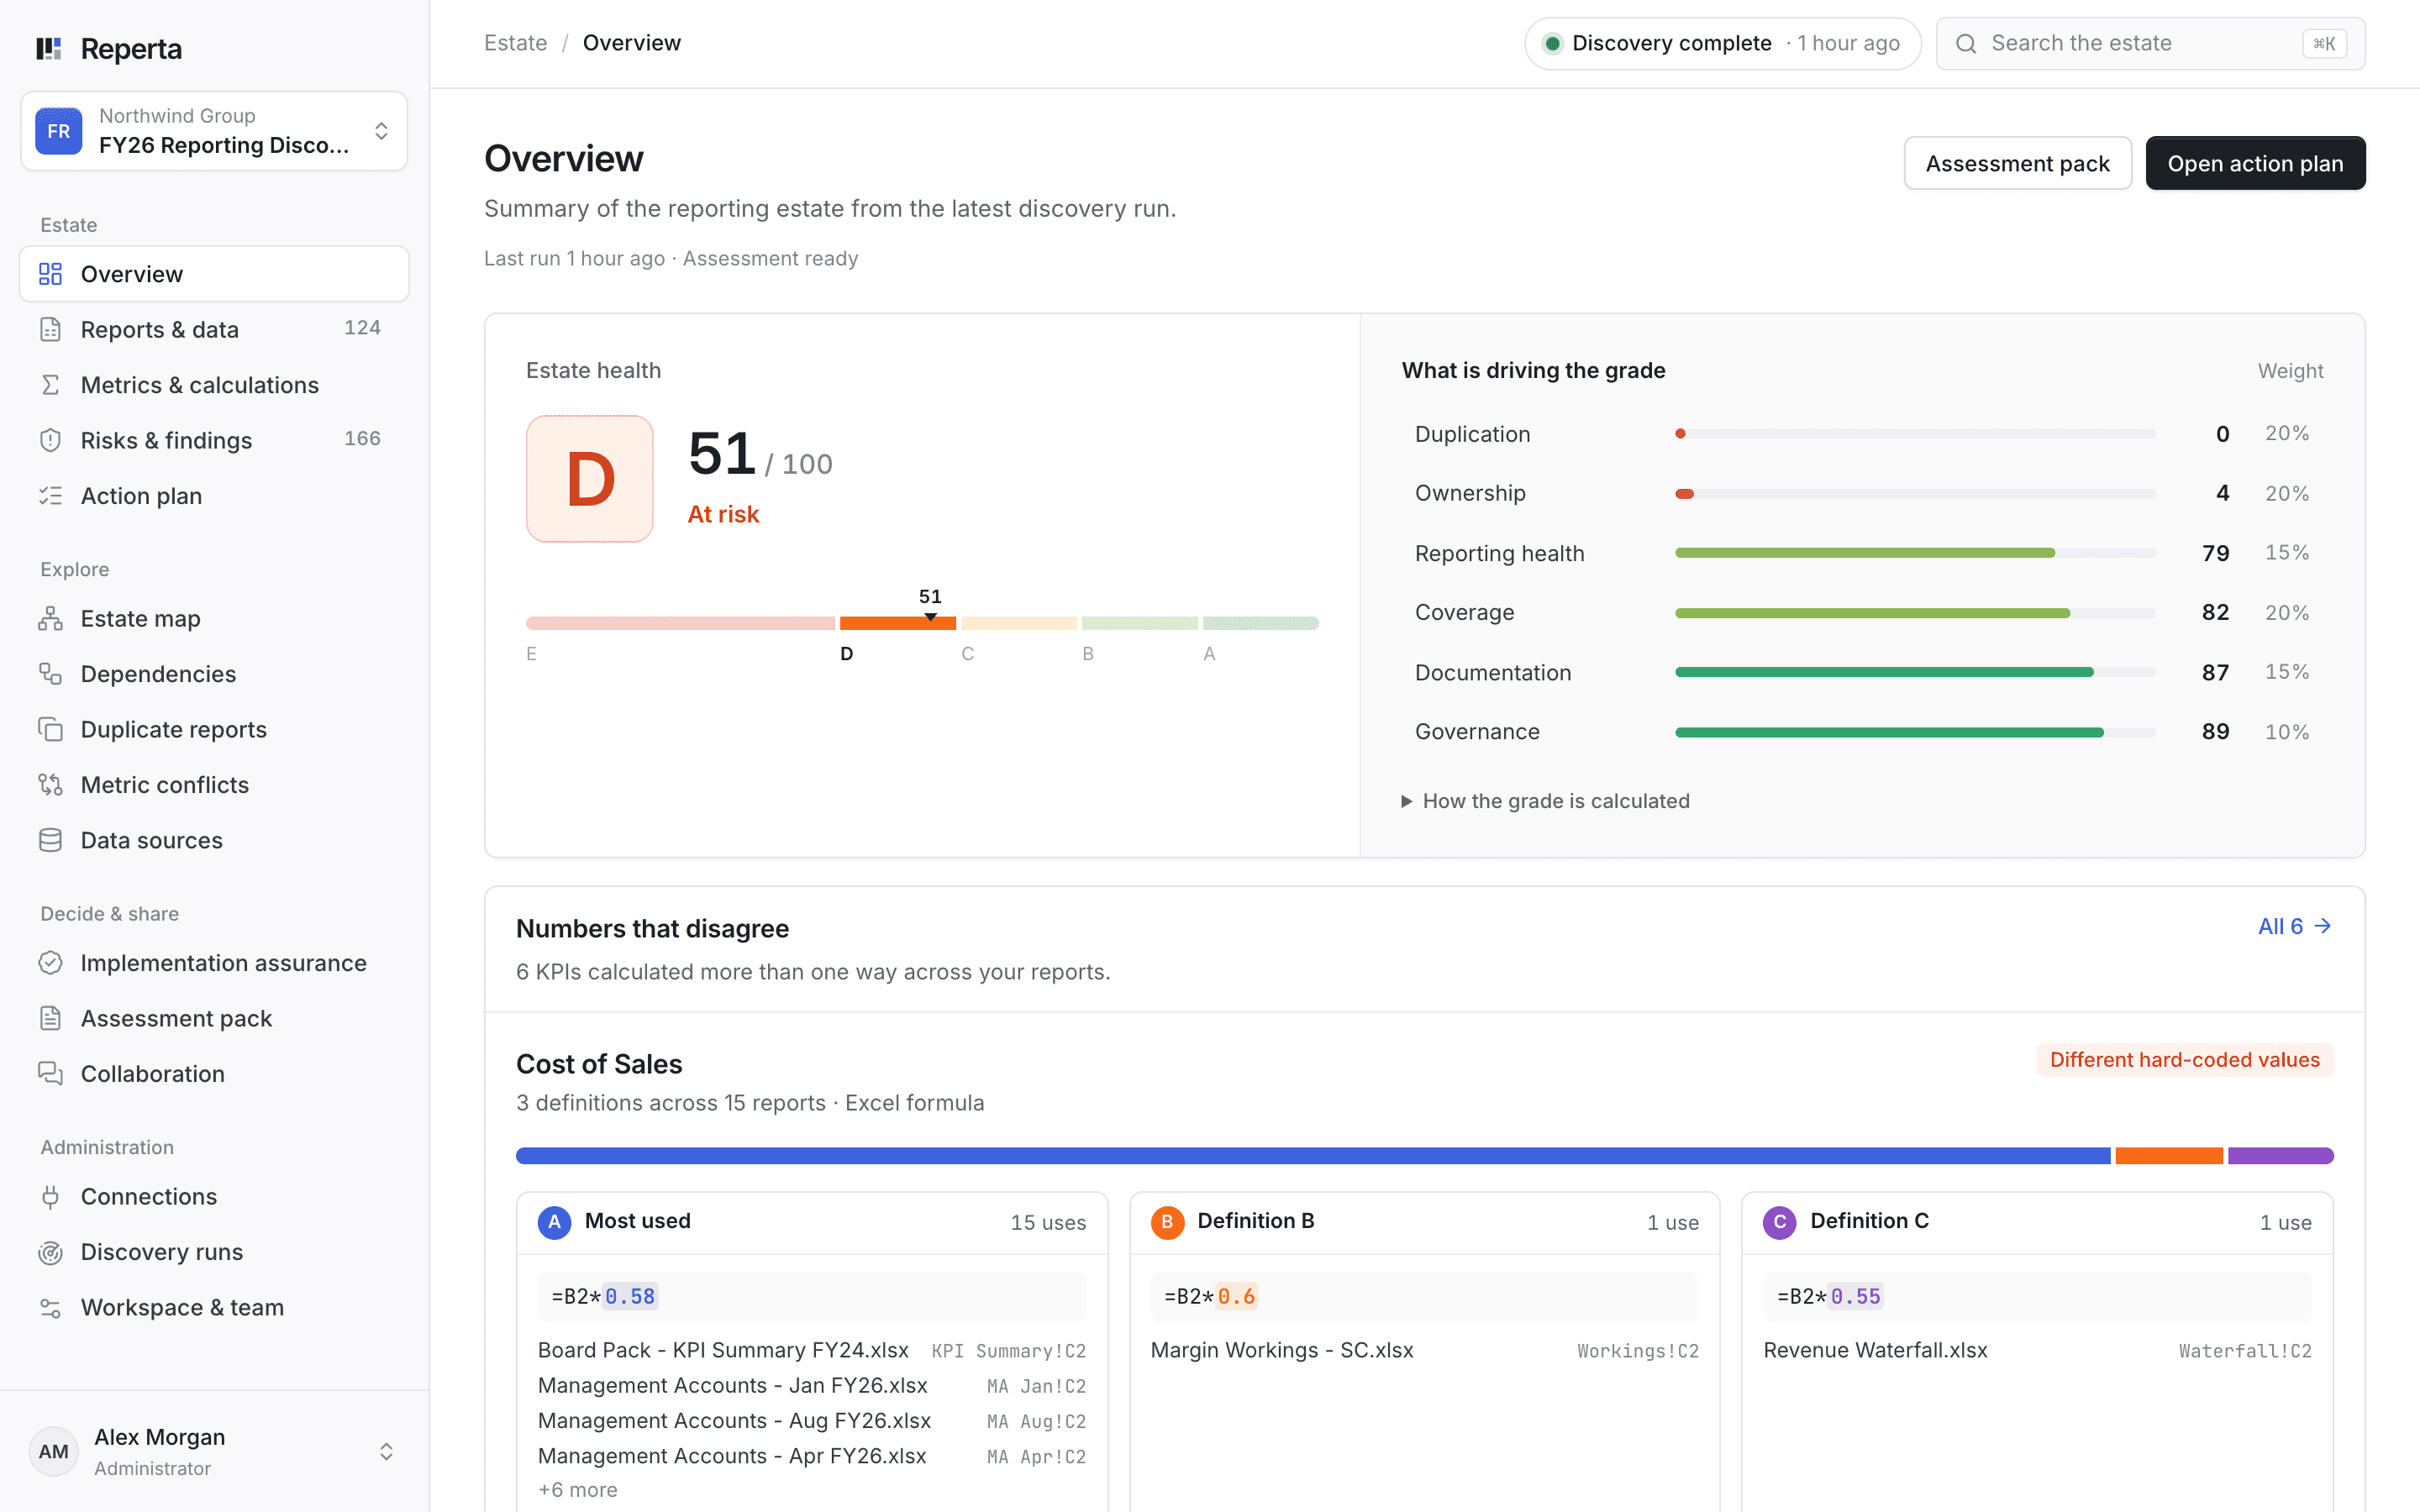
1Understand
See every report and how each number is made.
Reperta scans the sources you choose and builds a complete picture of your reporting: what exists, how it is calculated, what feeds what and where the risks are.
- A full inventory
- Every workbook, dashboard, report and dataset in scope, with its owner and recent use where that is recorded.
- Every calculation, traced
- Excel formulas, Power BI measures, SQL and report logic, followed back to their sources.
- Duplicates and conflicts
- Copies and near-copies grouped together, and every metric calculated more than one way.
- Dependencies
- Which reports feed which, so you can see the impact of a change before you make it.
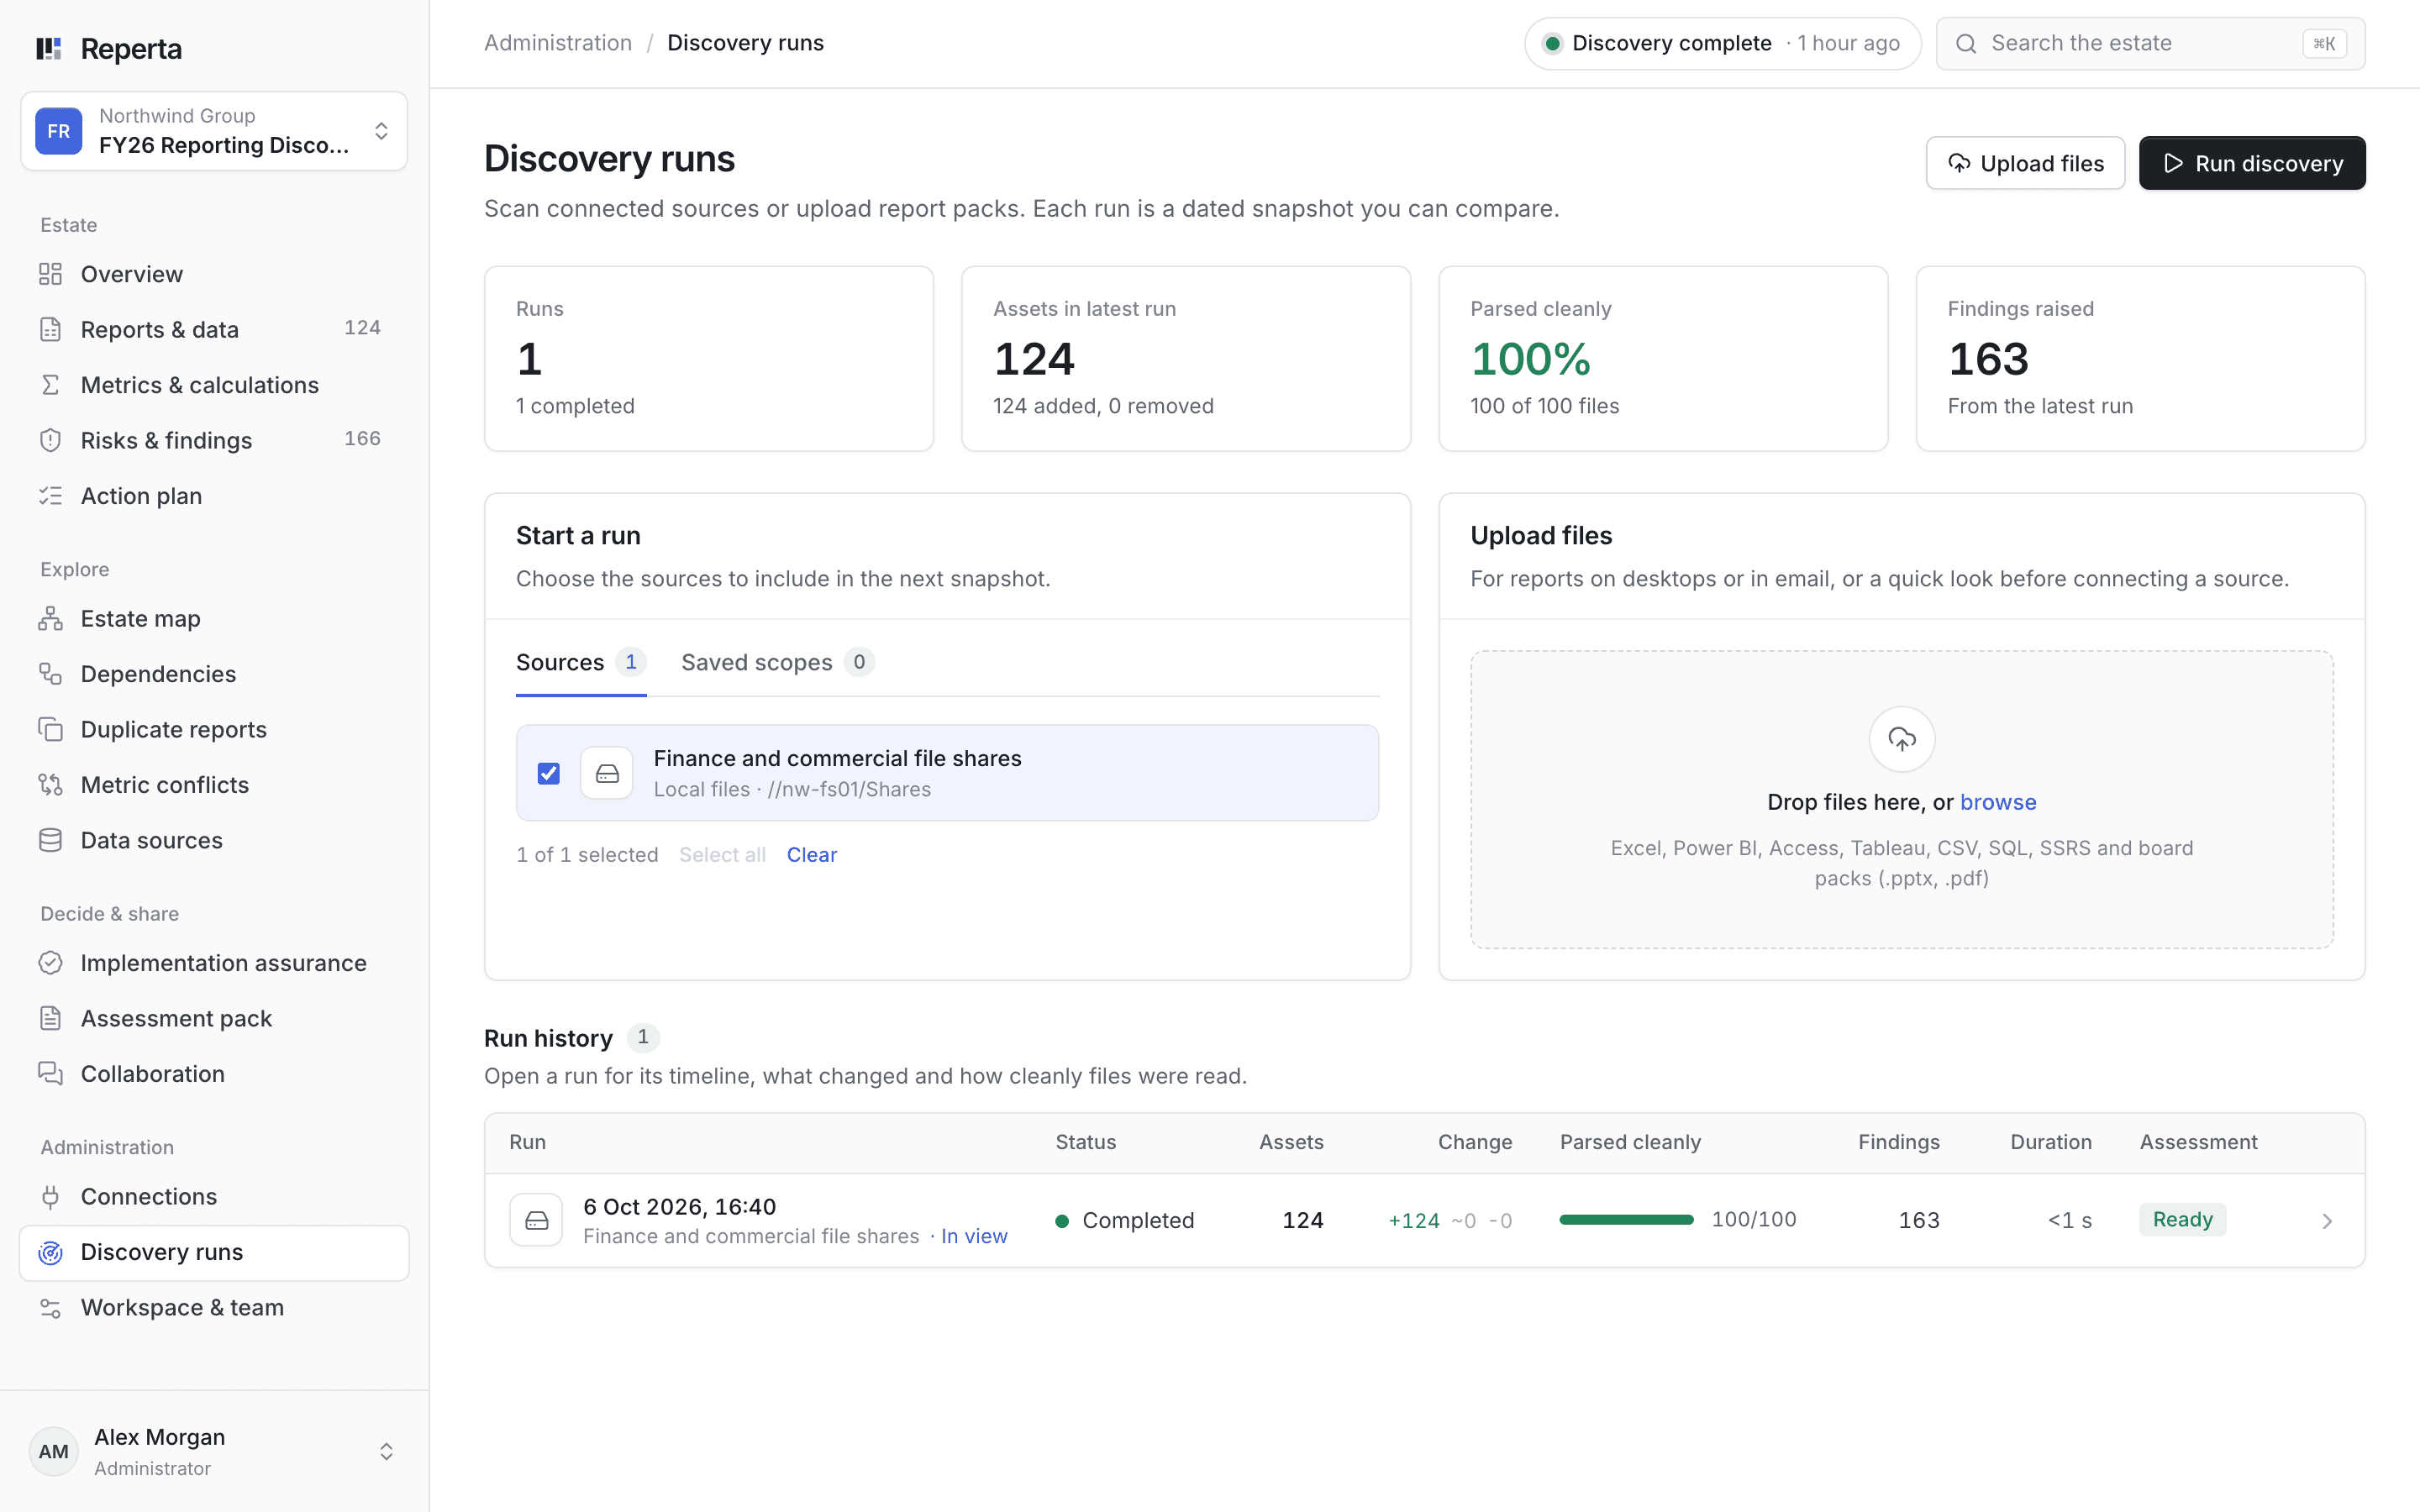
2Fix
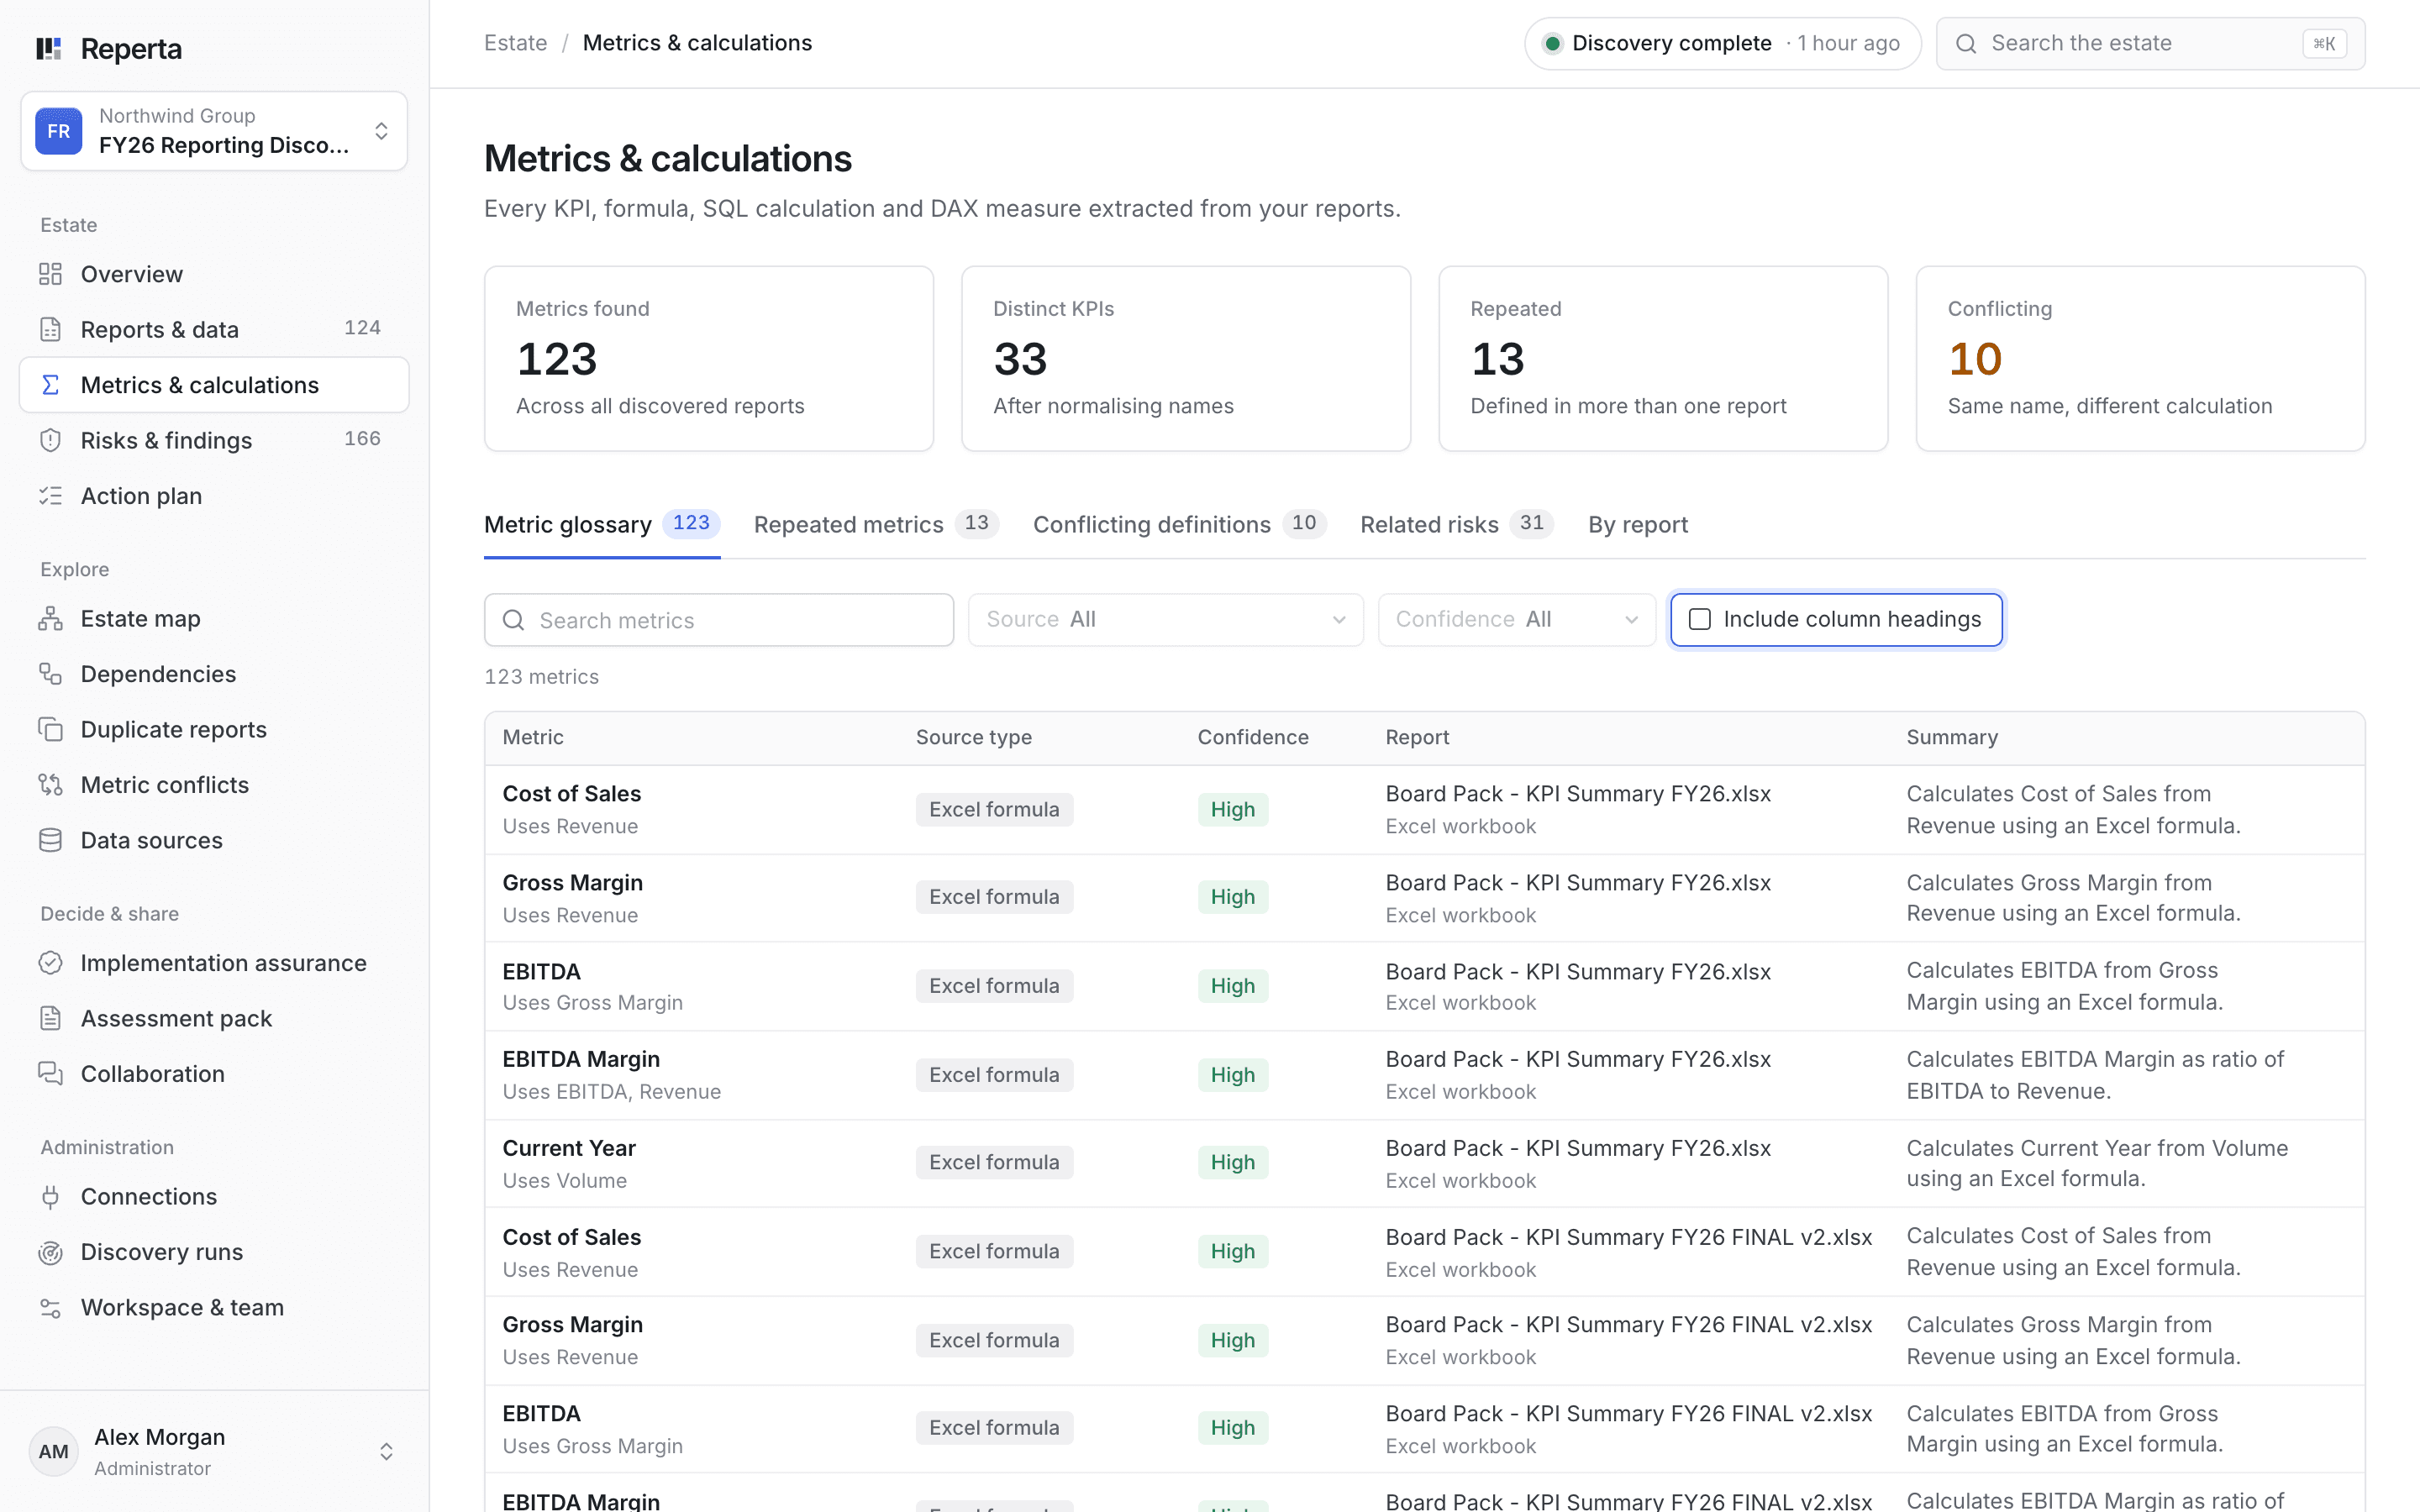
Agree the right figure and put it right everywhere.
When the same number is calculated different ways, the person who owns it decides which version is right. Reperta does the legwork around that decision.
- Side-by-side comparison
- Every version of a metric next to each other, with the reports that use each one.
- Owner sign-off
- A named owner reviews the evidence, picks the definition and records the reason.
- Prepared changes
- Reperta drafts the changes to the reports that disagree, for your team to review and approve.
- Checked results
- Results are compared against the agreed definition, so you can see the fix worked.
3Keep it right
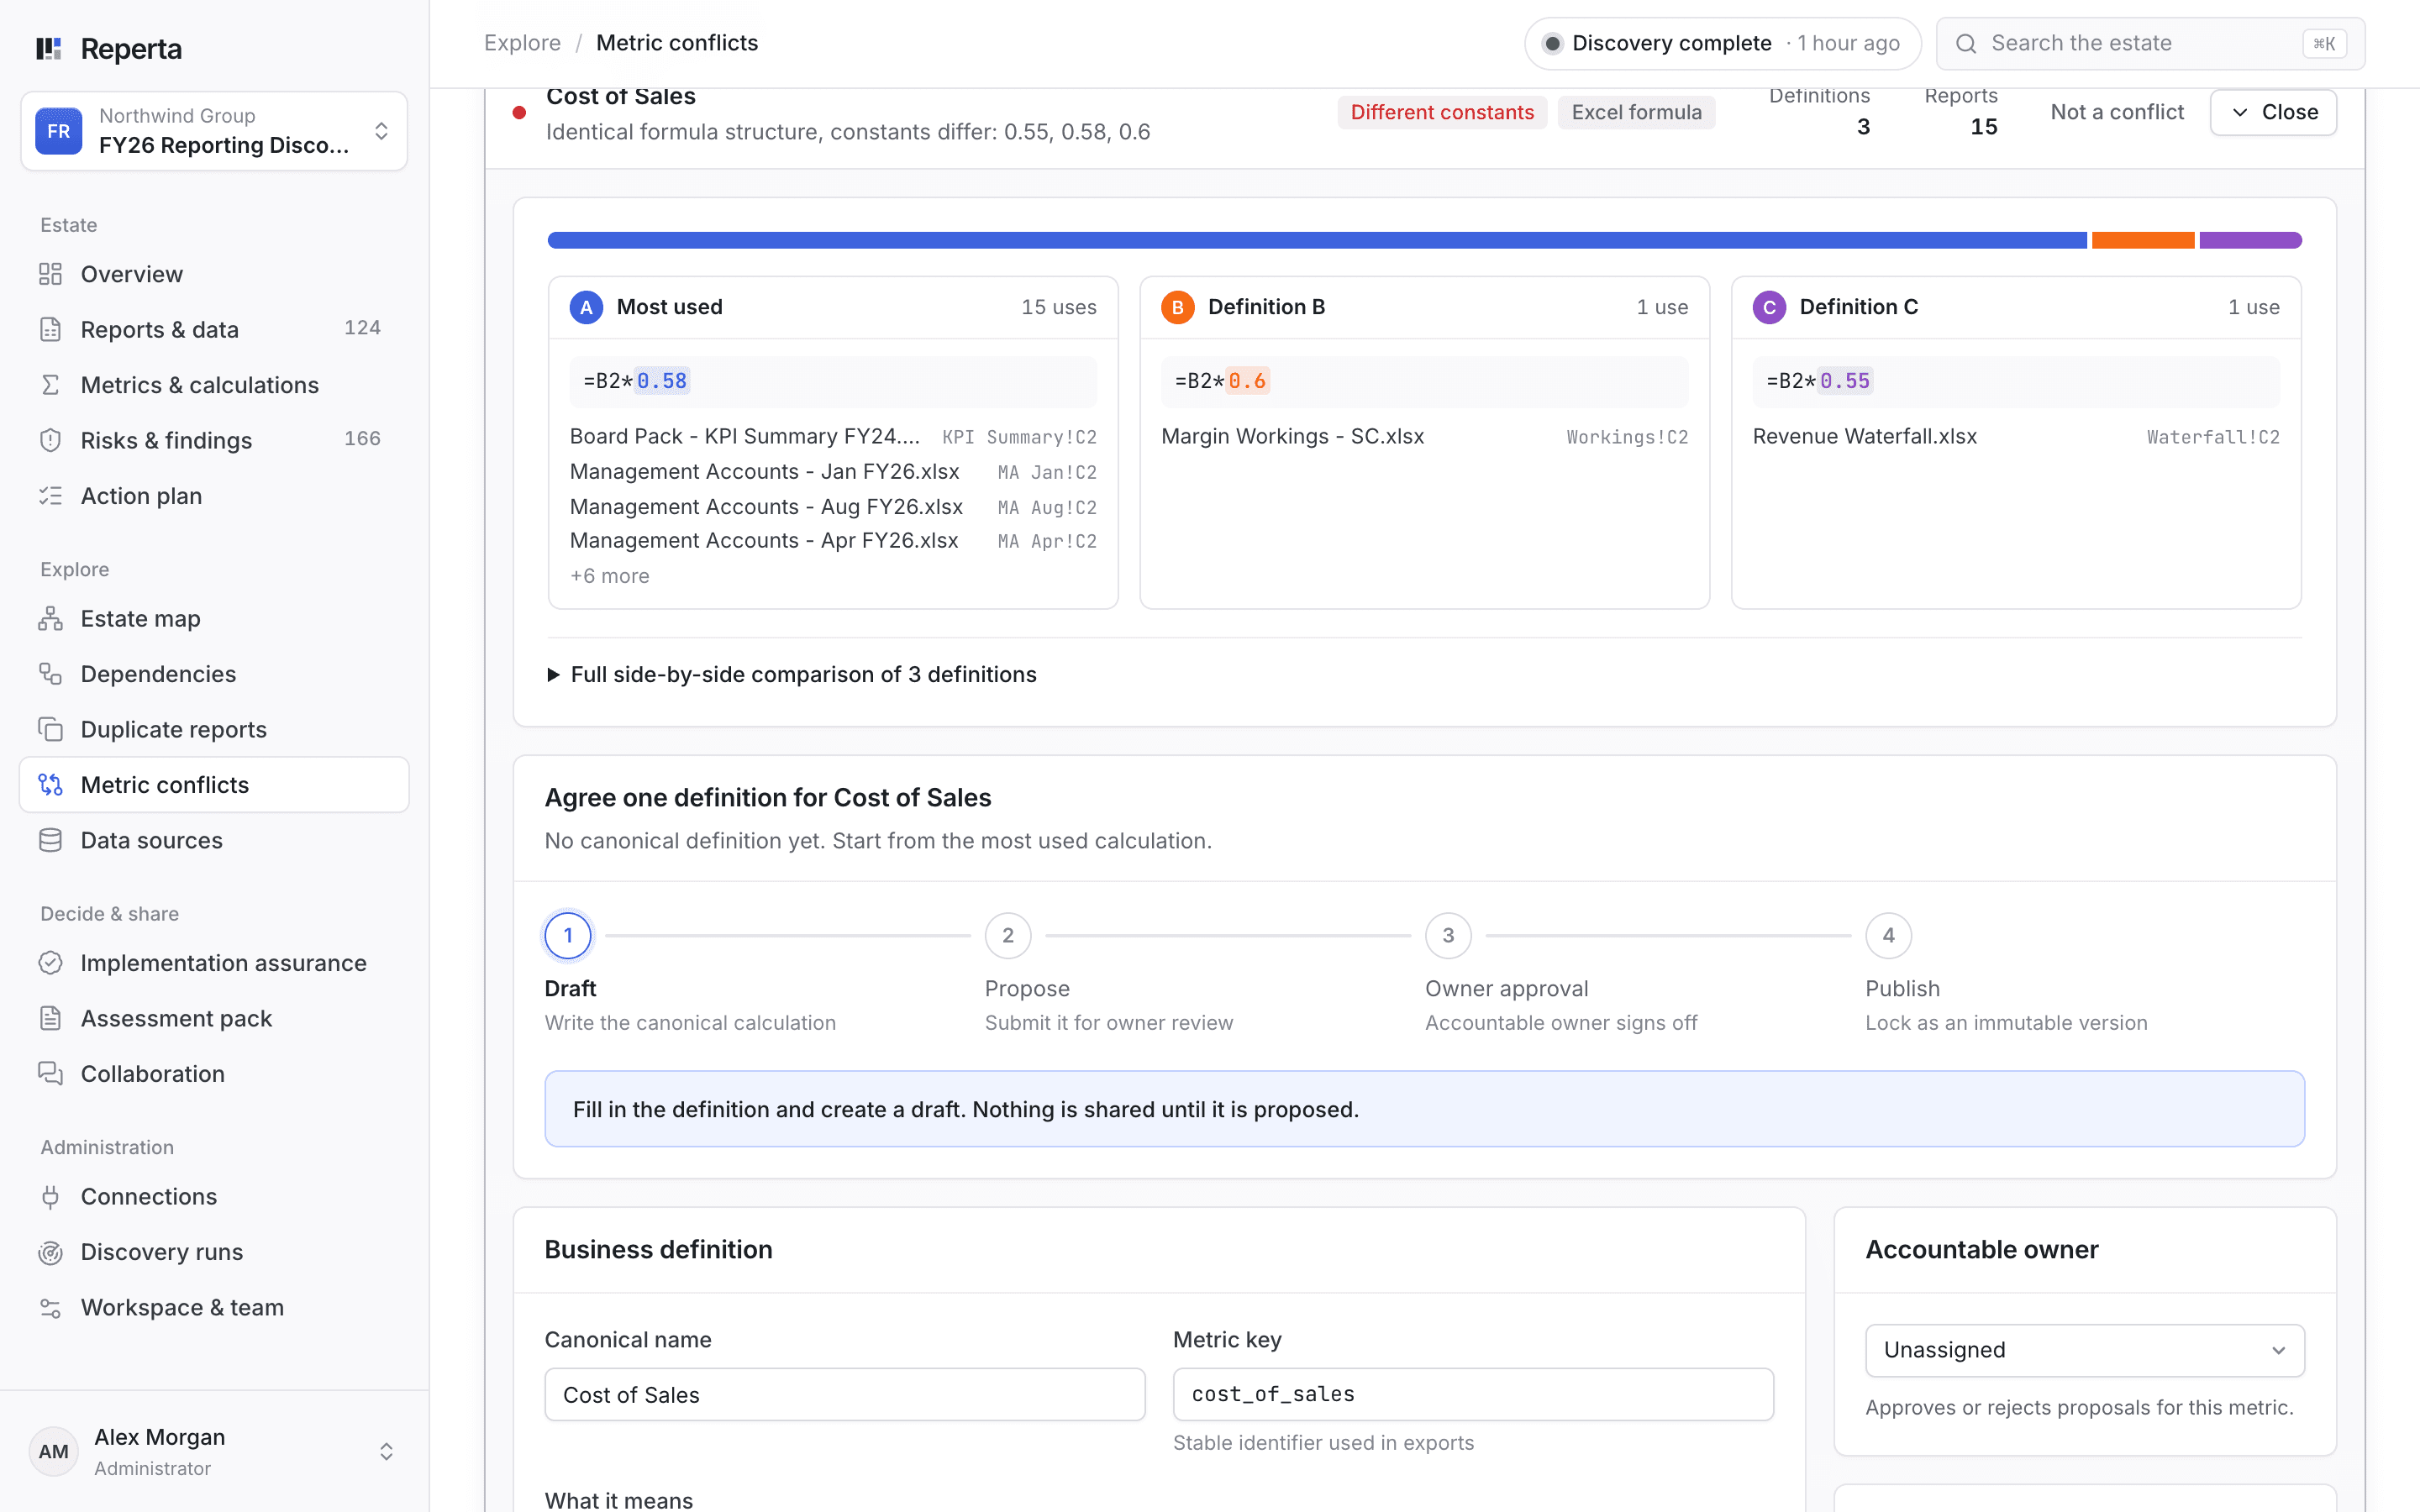
Stay right as your reporting changes.
New reports appear, calculations get edited and people move on. Reperta keeps watching, so problems surface early instead of in the board pack.
- Scheduled rescans
- Each run is a dated snapshot you can compare with the last.
- Change alerts
- Know when a calculation changes or a new copy of a report appears.
- Decision history
- Every definition, sign-off and change, with who made it and why.
- Reporting health
- Track duplicates, conflicts and unowned reports over time.
AI that shows its working
Reperta uses AI to read reports, explain calculations and draft fixes. Everything it produces links back to the evidence, and nothing changes until a person approves it.
Traceable
Every answer links to the report and calculation behind it.
Reviewed
Suggestions stay as drafts until the owner approves them.
Scoped
AI works only on the sources and data you put in scope.
More of the platform
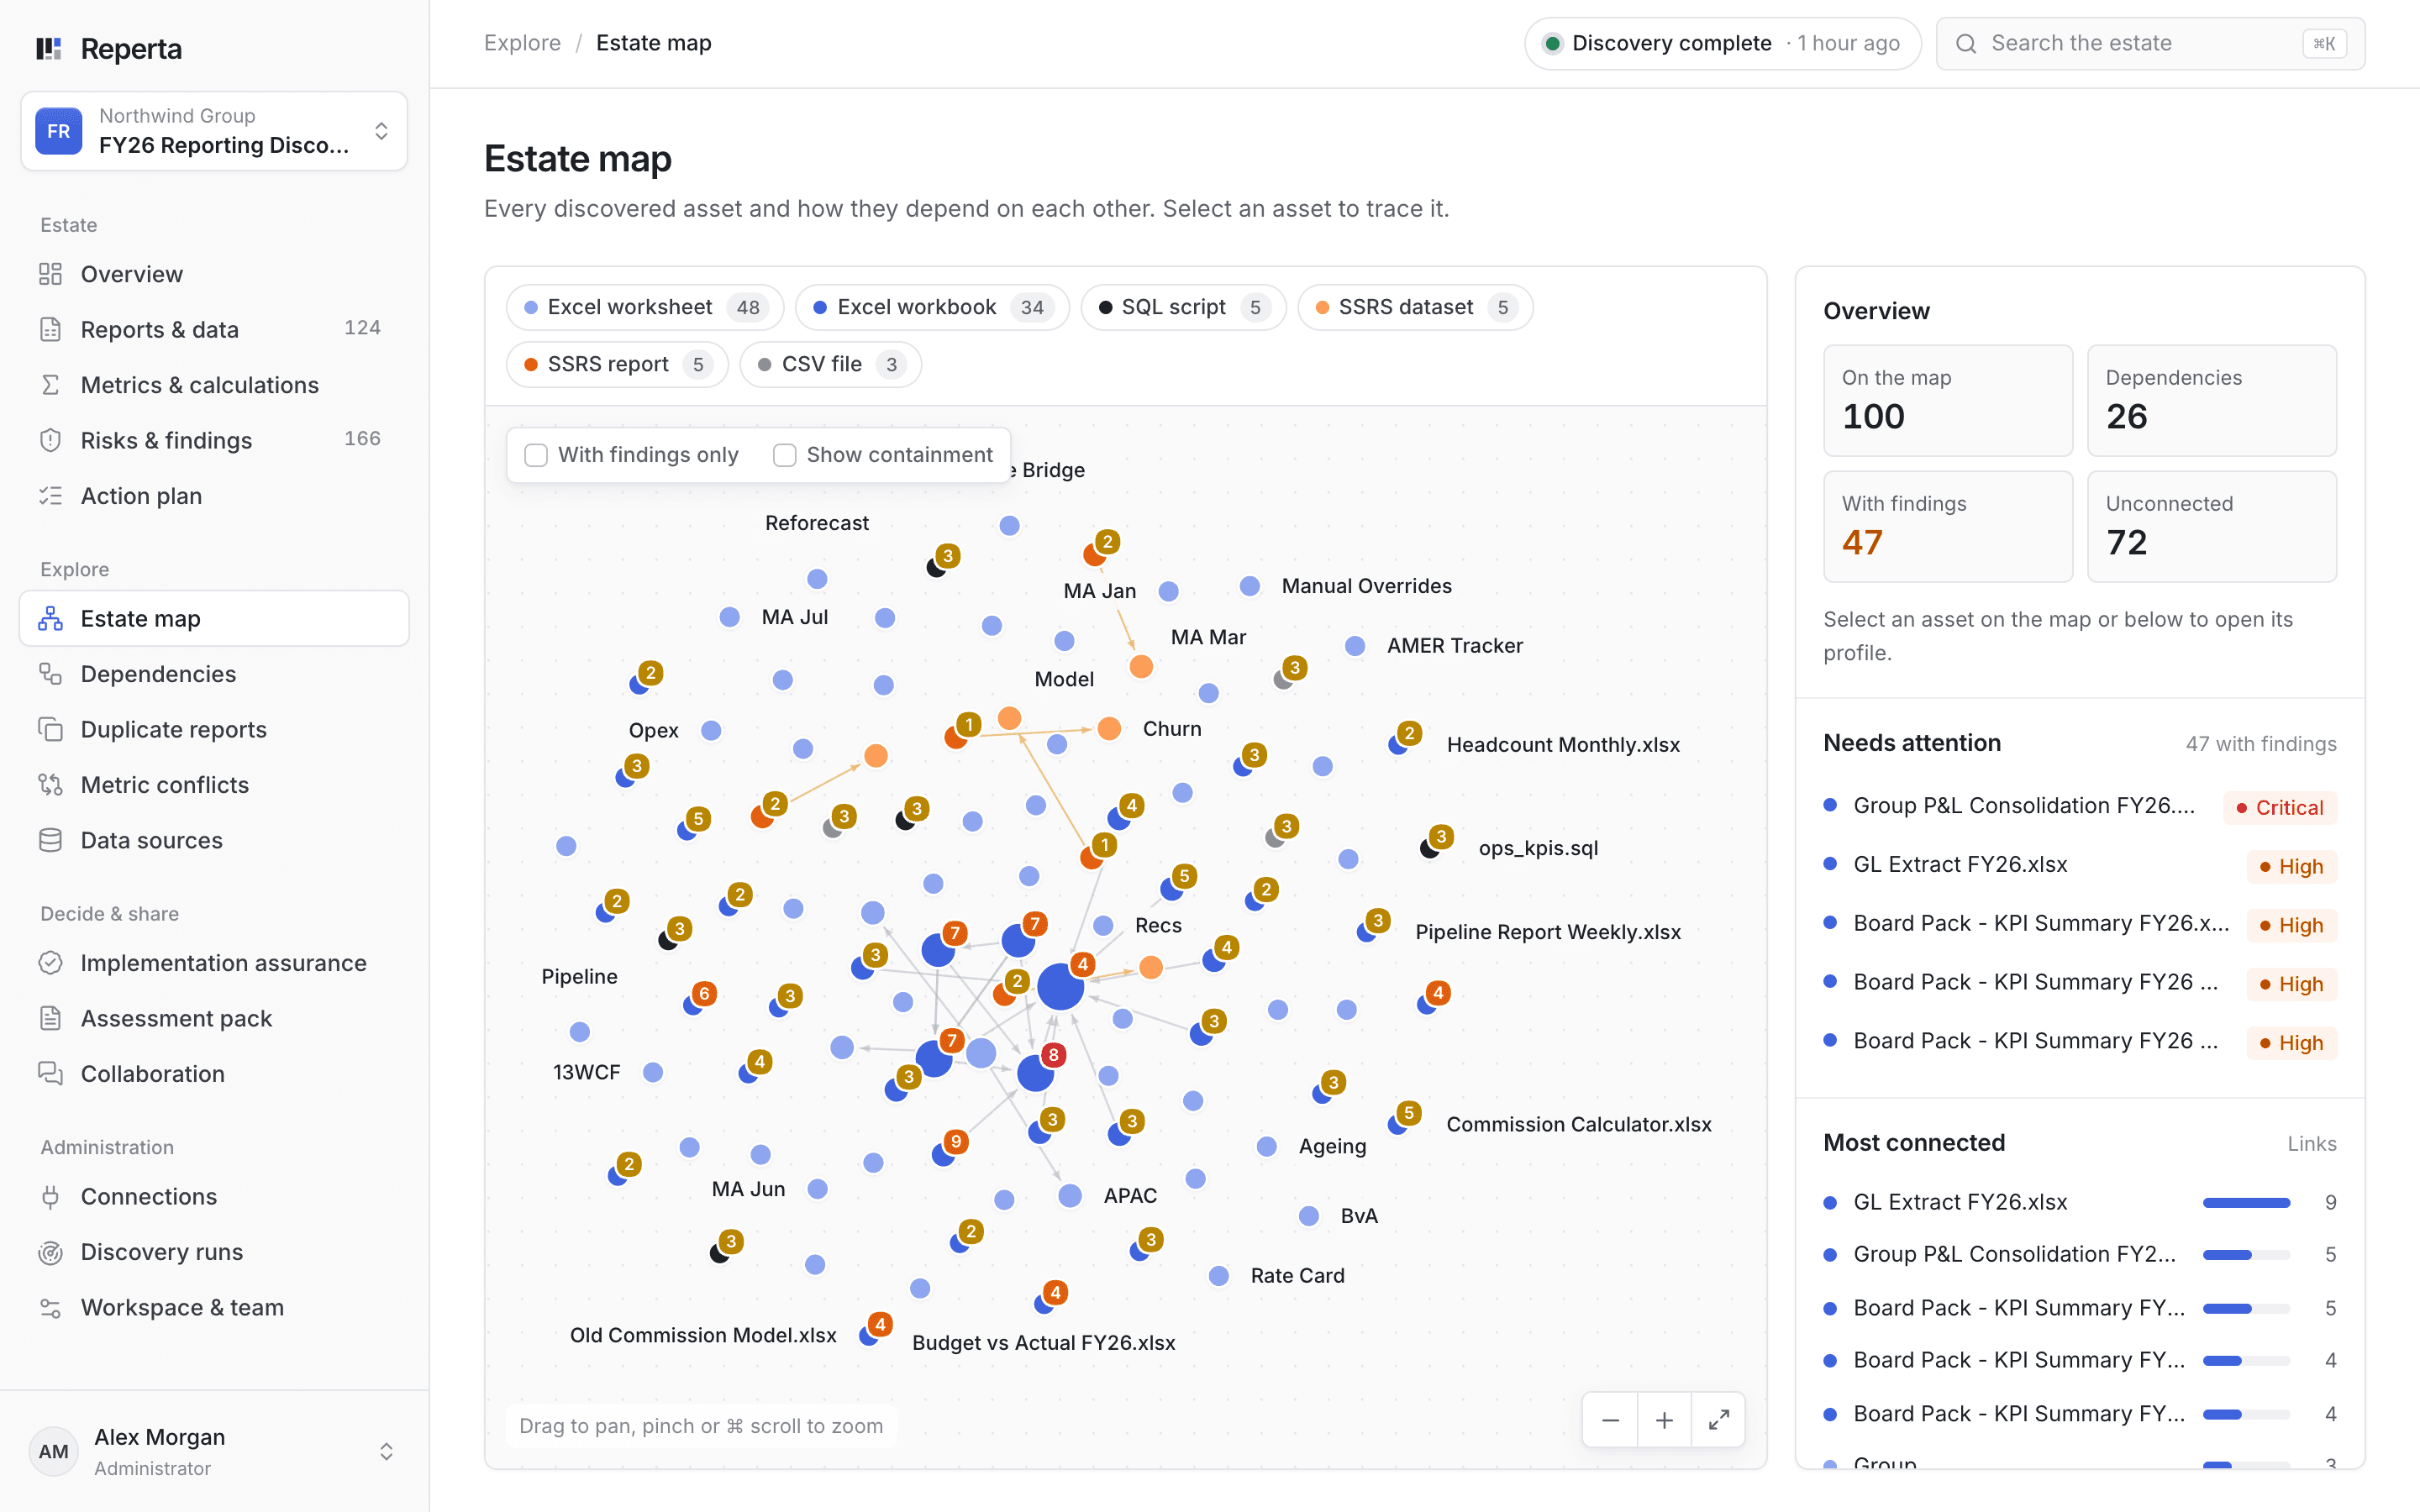
Estate map
Your reporting on one map, with problem areas marked.
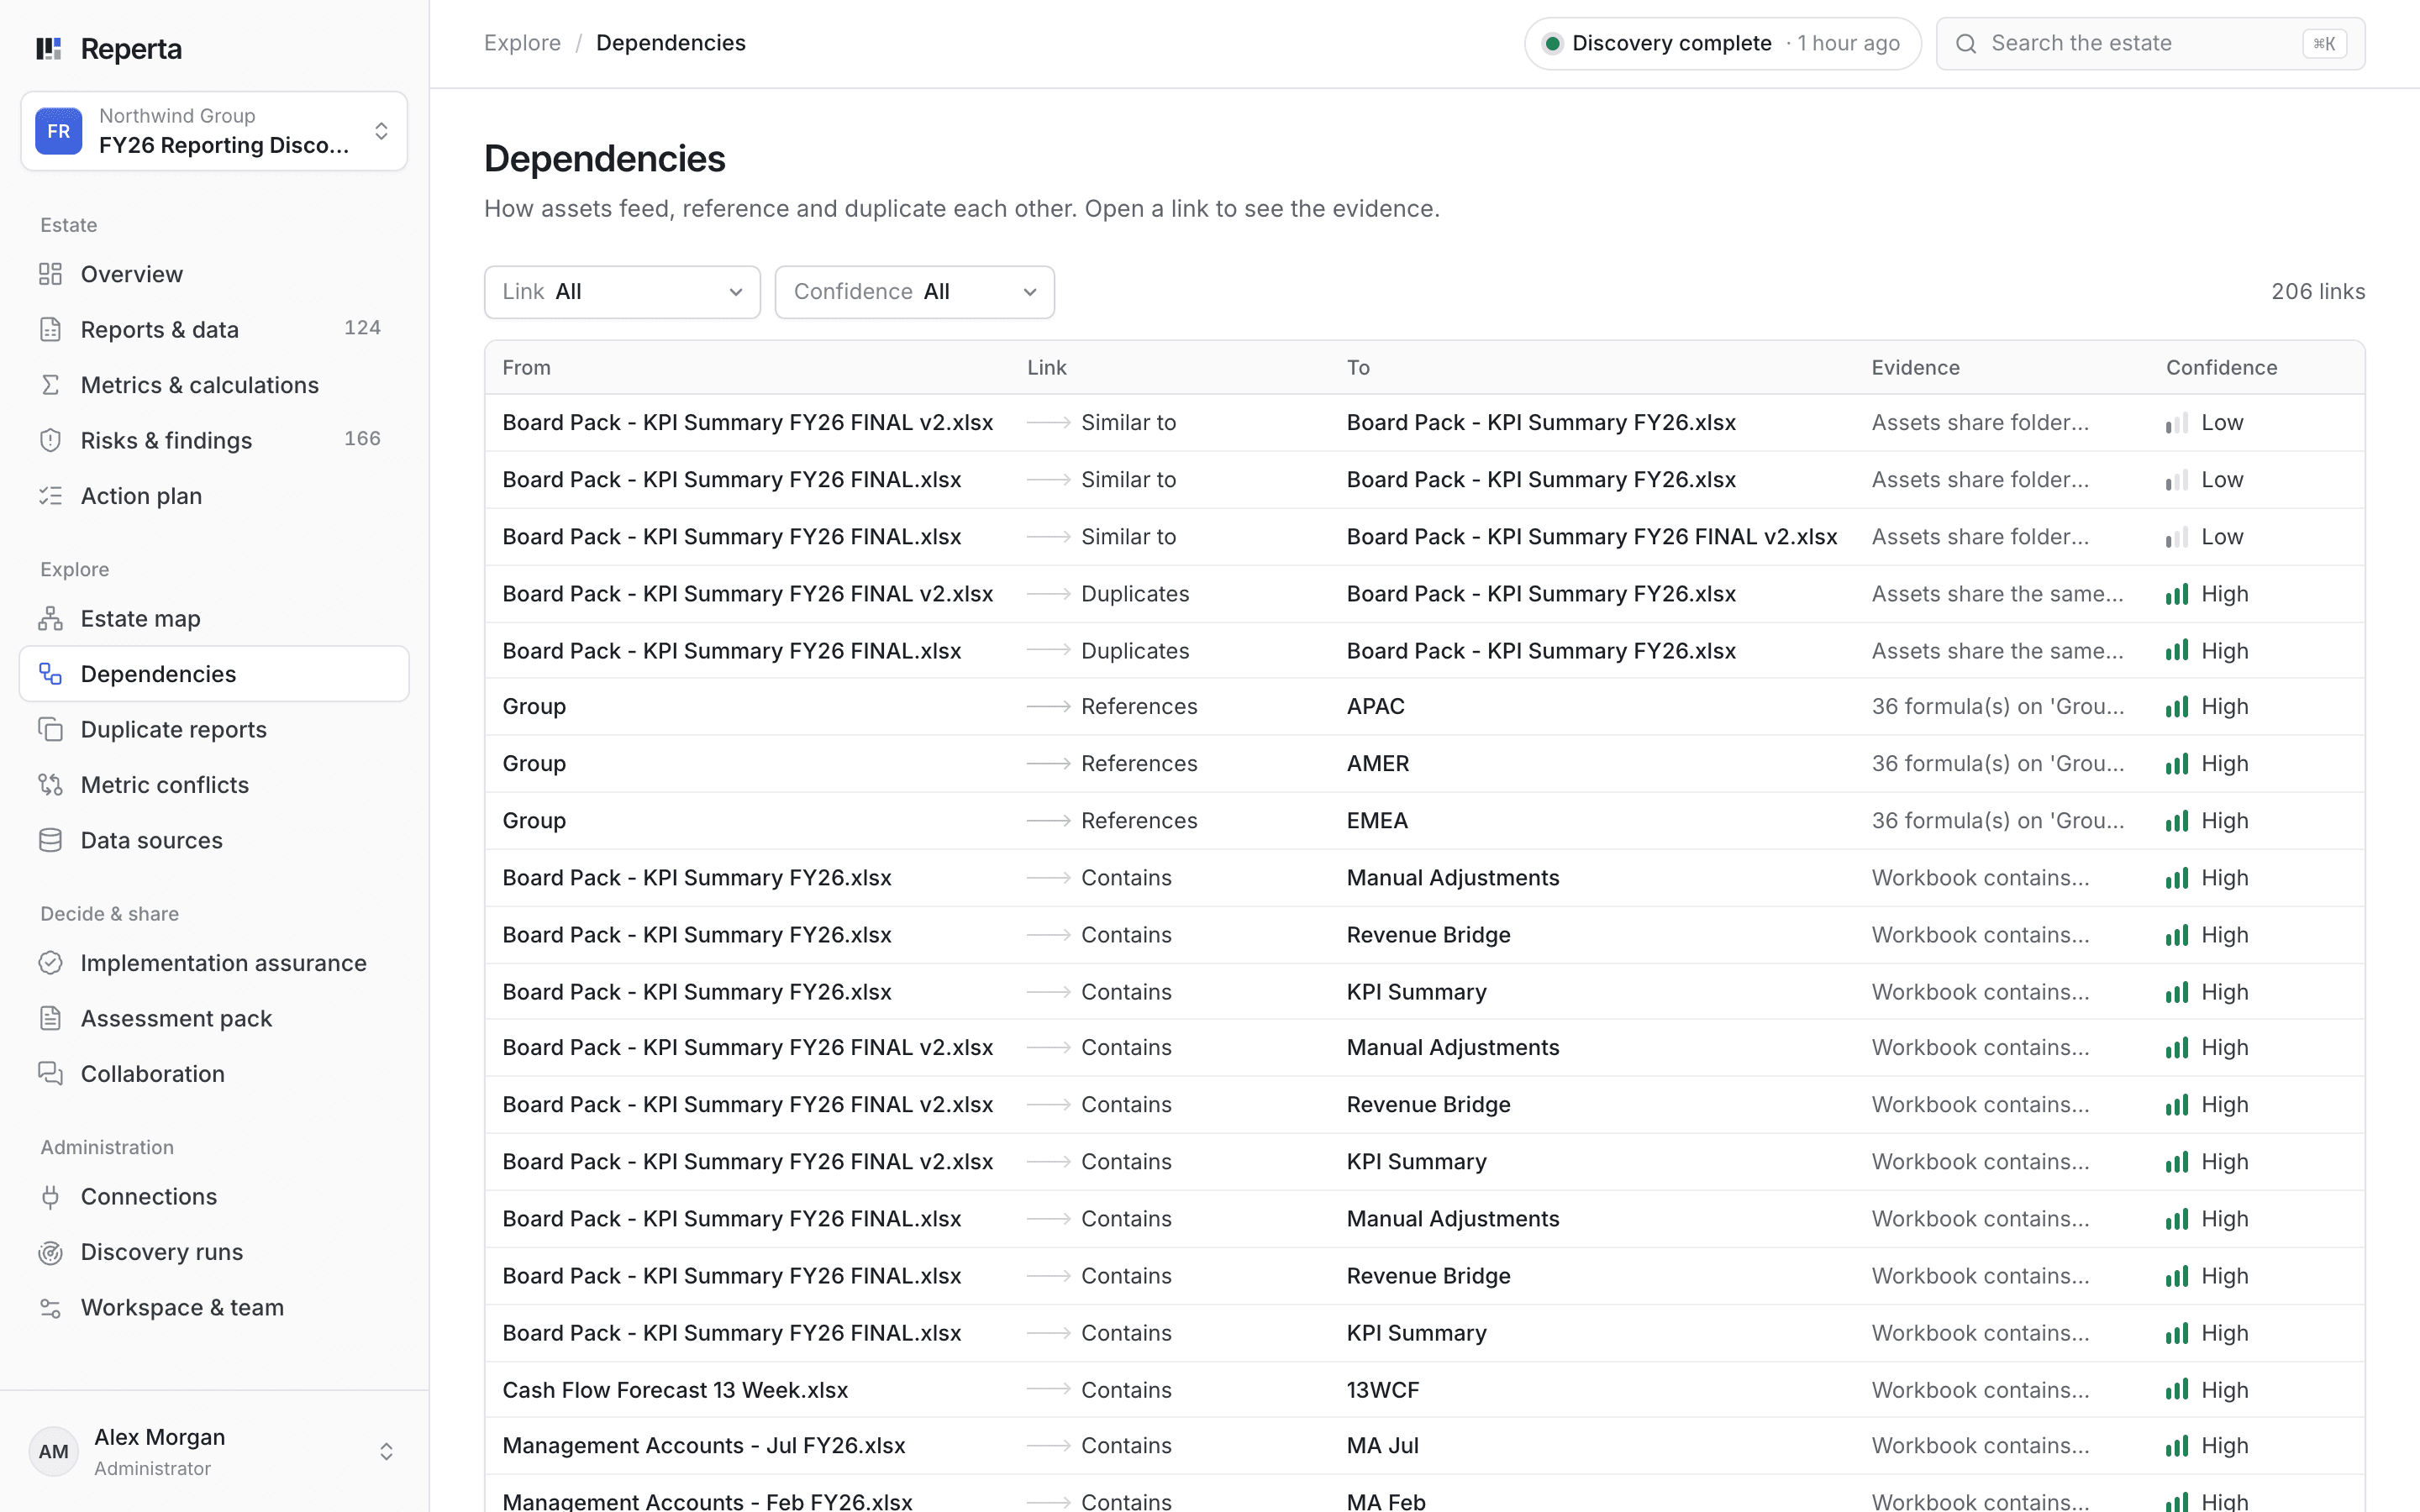
Dependencies
What feeds what, with the evidence for each link.
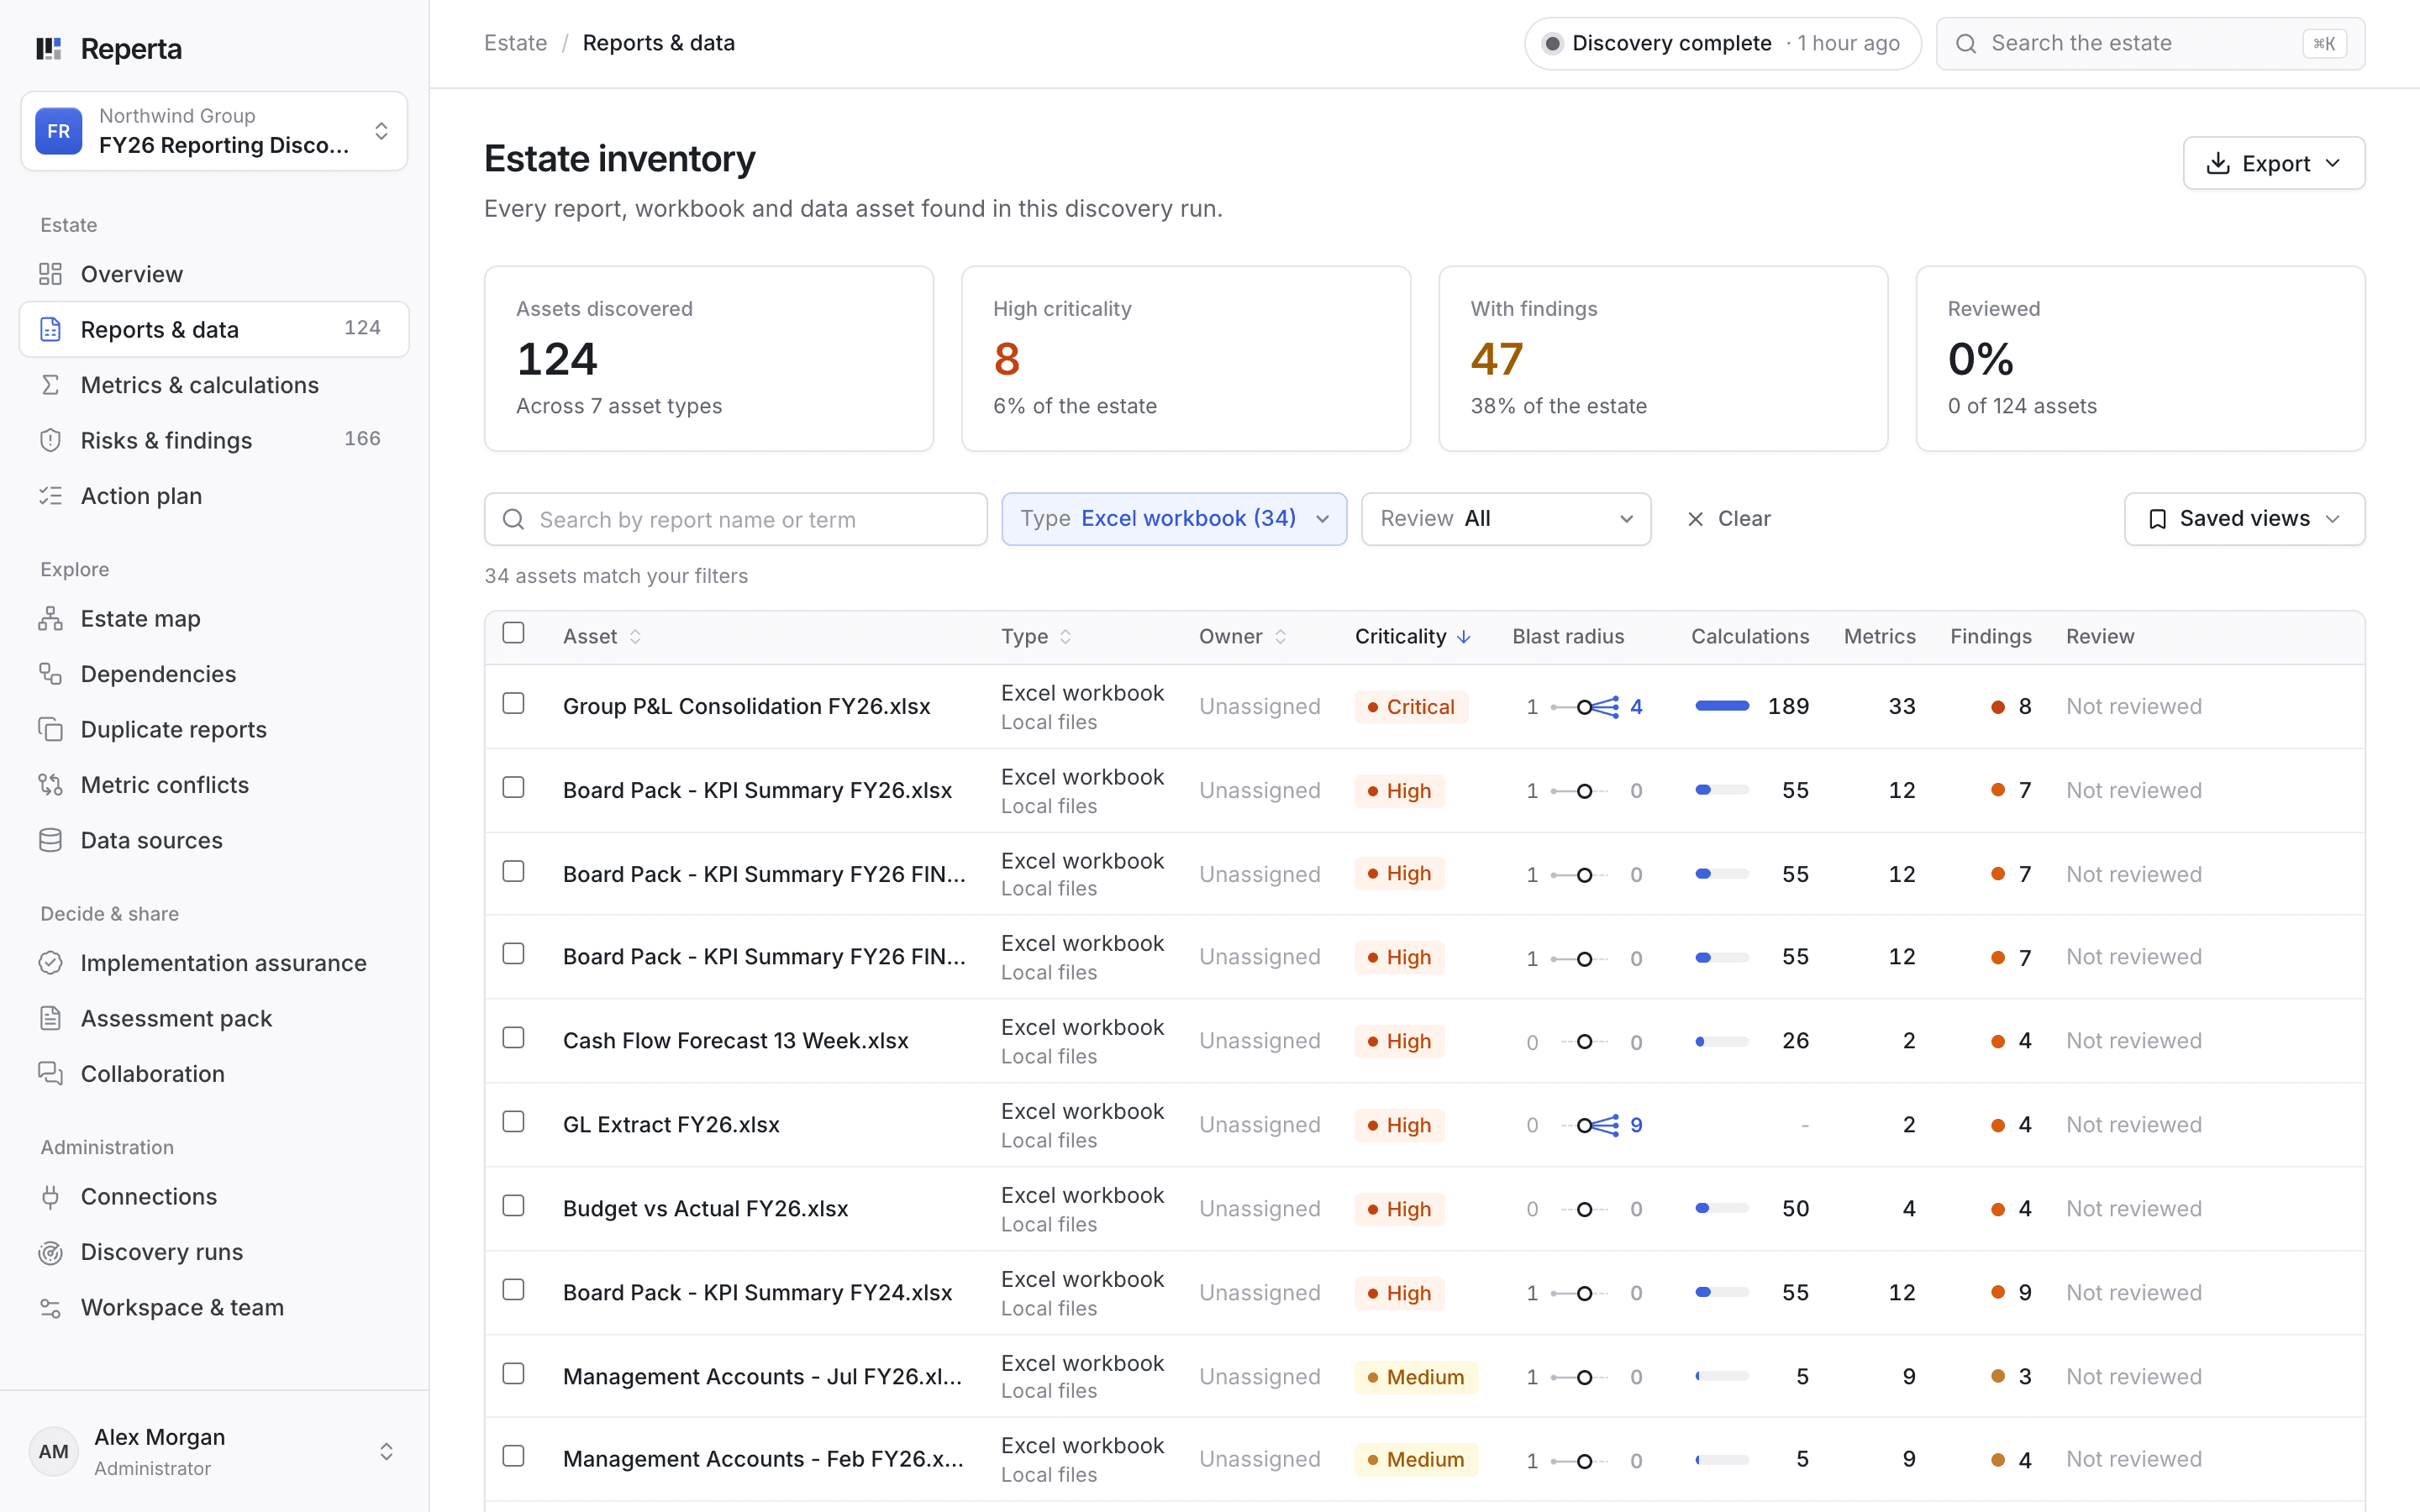
Reports and data
Every asset in scope, ranked by how much it matters.
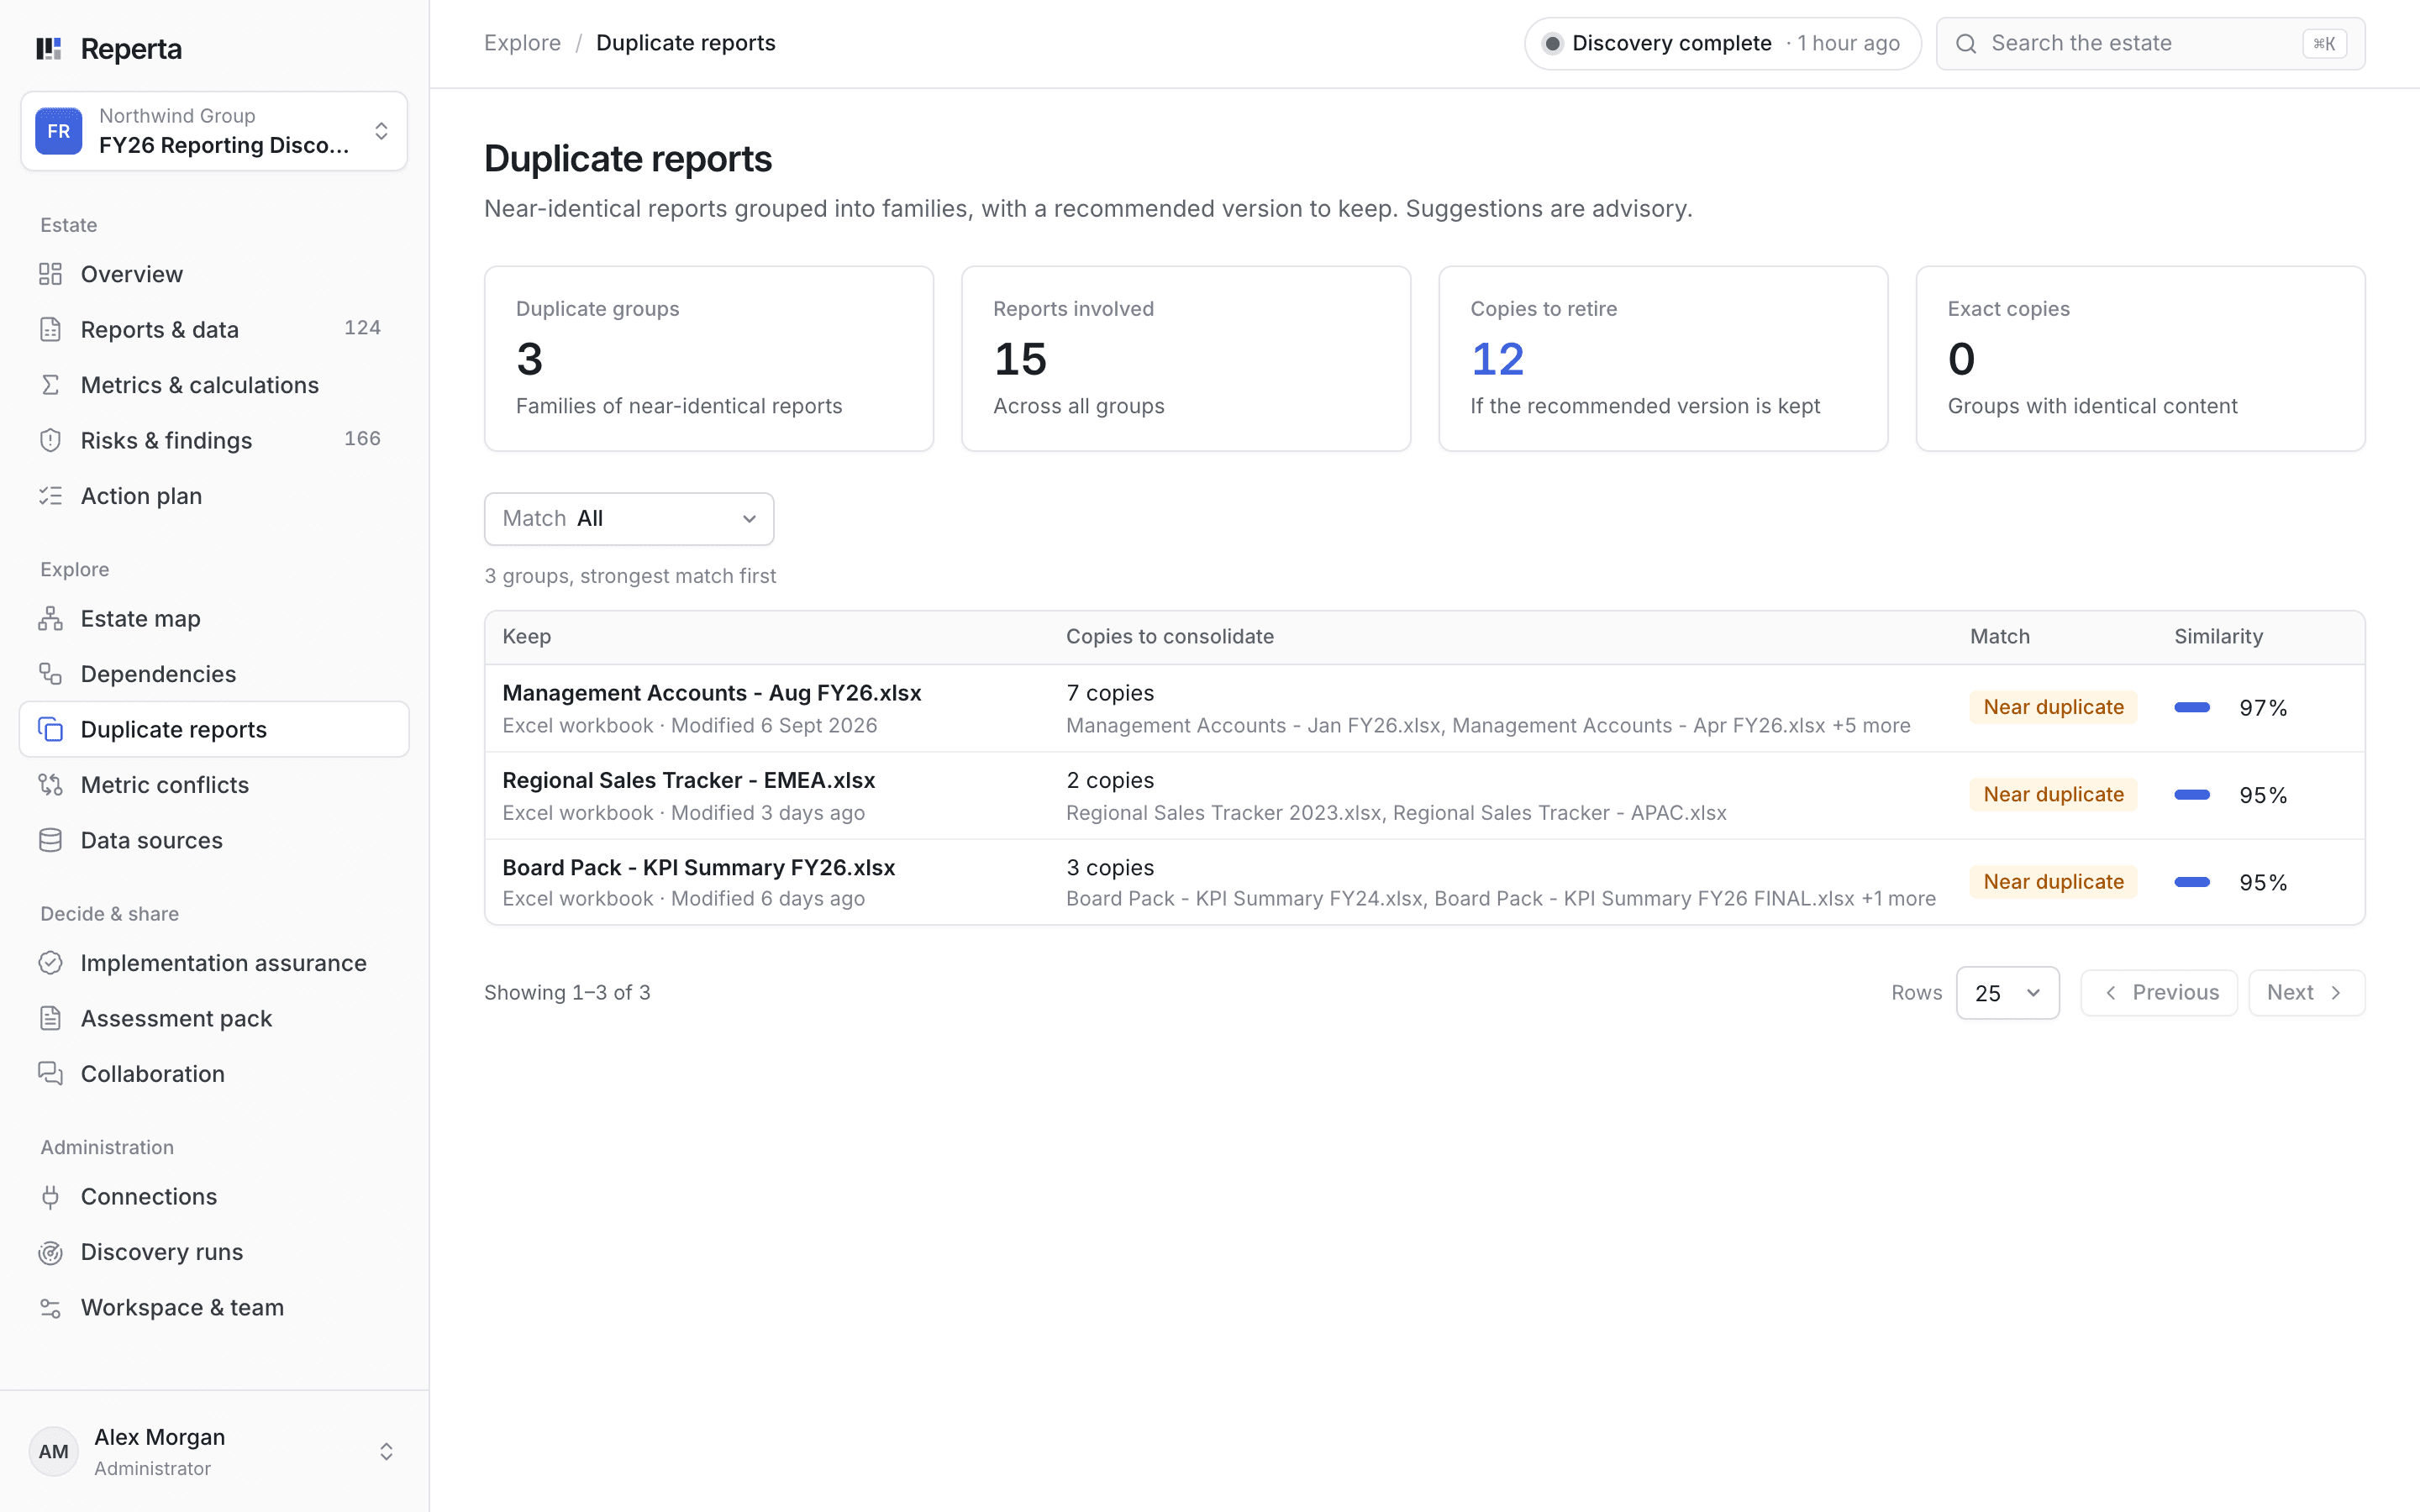
Duplicate reports
Copies grouped together, with a suggested version to keep.
Works with what you already have
From spreadsheets on a shared drive to enterprise BI. We confirm which of your systems are in scope on the first call.
Files and shares
- Excel and CSV files
- File uploads
- Network file shares
- SharePoint
- OneDrive
- Google Drive
- Amazon S3
Databases and warehouses
- SQL Server
- Oracle Database
- PostgreSQL
- MySQL
- Snowflake
- BigQuery
- Amazon Redshift
- Databricks
- Microsoft Fabric
BI and reporting
- Power BI
- SSRS
- Analysis Services
- Tableau
- Qlik Cloud
- Looker
- Metabase
- IBM Cognos Analytics
- SAP BusinessObjects
- MicroStrategy
Pipelines, apps and distribution
- dbt
- Azure Data Factory
- Alteryx Server
- Power Apps
- Power Automate
- Microsoft 365 email
The one you need isn't here? Tell us which one. We'll aim to have your connector live within two weeks, free of charge.
Ask for a connectorReady for your IT review
Security and data handling- Read-only discovery
- Least-privilege access, scoped to what you agree
- A separate workspace for each organisation
- Role-based review and approval
Bring the number nobody can explain.
Book a 30-minute demo. We will show you how Reperta finds what is behind it, fixes it and keeps it right.